Margin Depression
From the end of 1992 to the beginning of 2018, net interest margins in the Banking industry have declined about 100 basis points, with earning asset yields declining from 8.1% to 4.2%, and funding costs falling from 3.8% to 0.5%. This margin compression has been offset by either lower credit losses and/or lower net non-interest expense. So the question remains, where do margins go from here?
With funding costs either bottoming out last quarter for most institutions (or close to it) and the Federal Reserve telegraphing several increases in the Fed Funds Target Rate, funding costs are likely to increase over the remainder of the tightening cycle as customers begin their secular migration back into higher yielding deposit products.
The focus shifts to earning asset yields and whether institutions will be able to pass along increases in the Prime Rate and other rates along the Treasury yield curve by raising loan rates. We will examine factors impacting earning asset yields and suggest strategies to stabilize risk-adjusted earning asset yields.
What’s In the Mix (Risk vs. Return)
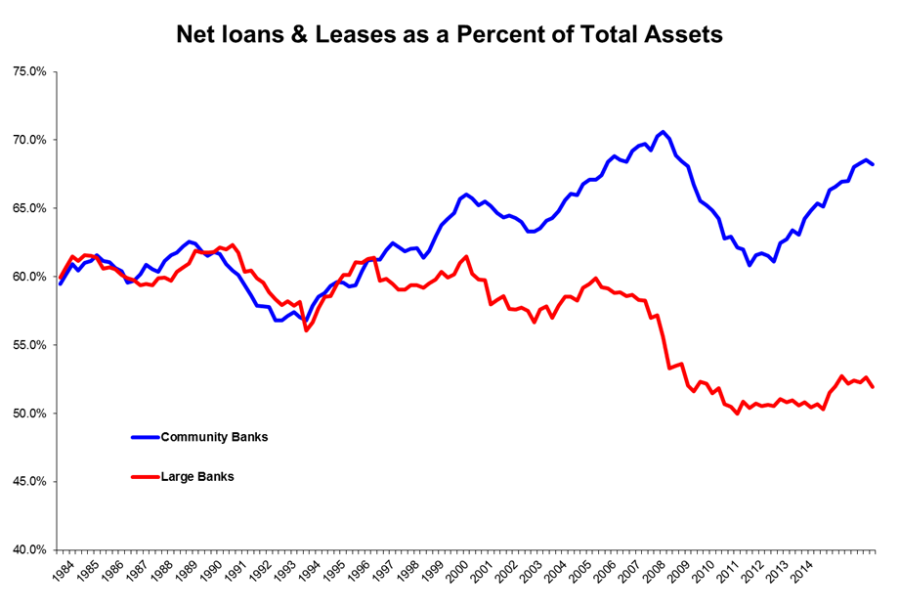
Community banks have seen their loan to asset ratios recover from low 60’s to high 60’s, levels not observed since 2006-2009. As loans become a larger share of a community bank’s balance sheet, it is important to discuss term structure and the credit environment. With competition pushing CRE loan rates below the Prime Swap curve in some markets, bankers need to have a pulse on their bank’s key balance sheet positions such as interest rate risk, capital, and liquidity when adding additional loan volumes. Regularly grading/evaluating earning assets on a risk-adjusted return basis will help ensure the right earning asset selection and mix for your balance sheet.
It is also interesting to point out that large banks (approx. 80% of the loan market), have loan to asset ratios near historical lows. Carrying larger investment portfolios and cash balances could very well be a function of the Fed’s large bank High Quality Liquid Asset test.

Behind the Curve
Did you know that over the next five years the yield curve is pricing in short term rates increasing 180 basis points, up to 3.20%? This also happens to be the same level the FOMC has telegraphed with the release of their most recent DOT Plot table, so adding some duration with call-protection to your earning assets isn’t necessarily a bad thing. The reason being is you are getting compensated today regardless of whether the Fed Funds Rate increases actually materialize. The challenge comes in identifying assets that compensate you adequately for going out on the curve, but also protect you in the event that short term rates don’t increase, or more importantly, for potential deterioration of an assets’ credit performance in the future (CECL).
Prime Loans to Go
With good loans hard to come by in some markets in this expanding economy, institutions have struggled to increase loan rates. Competition is driving the discussion in loan committees and loans once considered non-prime are being priced as if they were prime. Some institutions have relied on traditional indirect channels to drive loan production. And some institutions have ventured into non-traditional fintech platforms to boost lending. This has created a new asset class for institutions into signature lending to individuals who don’t live anywhere near their communities. Does this strategy make sense?
Conclusion
We are definitely in uncharted territory, with massive amounts of stimulus being removed from the system and earning asset yields struggling to come off their lows. Stay disciplined when evaluating unproven lending practices just to meet budget. Don’t forget what happened to all those stated income prime & sub-prime loans. Finally, when extending rate terms on assets, reserve them for the highest quality assets and incorporate a barbell strategy in the investment portfolio to improve duration-weighted returns.
You have already subscribed to distributions. Thank you for your interest in our publications!
